- Link to ZIP File [Files and Data]
- Link to Demo
Intro
Challenges
Takeaways
What’s Next for App
What’s Next for John
API Notes
Other Notes
Last Minute Updates
Introduction
Hi. I’m John Williams. I have a passion for science and nature, particularly astronomy. I’ve always been inclined this way. Always outdoor as a kid, I explored the glaciated hills of northeastern Kansas. I marveled at the fossils, limestone caves, intense thunderstorms and a starry sky created by life away from the city. I used to sit back in the grass as a kid and watch a few satellites fly over. I learned all the constellations and I fell in love with the stories my relatives and friends made up about the sky. And I found, I love to share stories.
This passage from Robert MacFarland’s The Old Ways has stuck with me during this journey.
“For some time now it has seemed to me that the two questions we should ask of any strong landscape are these: firstly, what do I know when I am in this place that I can know nowhere else? And then, vainly, what does this place know of me that I cannot know of myself?“
Once while spending the night with my grandma, I spied a fuzzy patch out the window. I asked her what it was. She didn’t know. The next day we went to the library. I searched. The joy of searching: that possibility of finding was intoxicating. More important than knowing, for me, was the idea of sharing.
My daughter and my wife have noticed something during this journey. They say I say ‘I wonder…’ a lot. It’s that spark of curiosity revitalized.
ATLAS helped me realize I still love telling and sharing stories. Through creative coding, physical computing projects and empathy and technology, my focus has been honing my storytelling not just with writing but with new tools, such as video, coding and data visualization. What I’ve enjoyed most is using web technologies to create a way to know, like my Planetock or new, unexpected pieces of art like a card creator, milky way generator and low-poly art generator. All of these projects let the user explore unique stories. This also fed a fascination with the ways we explore the edges of our knowledge and leaps into the adjacent possible.
The adjacent possible is a kind of fuzzy future; where talent meets ideas. There is a time for an idea and it comes together when you make enough connections; when you start seeing things no one else is seeing. It doesn’t happen in a vacuum. It happens all the time in an idea-sharing environment like ATLAS. It’s the possibility of seeing more with data that drew me to using a detailed but hard to find and hard to use dataset of solar spectra from the National Solar Observatory.
The cool thing about dark skies; when you let your eyes adjust, is that the stars glow in reds, yellows, blues and greens. It turns out there is information in the stars. Maybe not answers to life and everything here on Earth. But to the universe… yes!
Those colors, that starlight that has traveled for thousands of years to activate the cones and rods in our eyes, contains incredible amounts of information from the age of stars, how the stars are moving to what elements are present and what processes are at work.
Isaac Newton discovered that the Sun’s white light is actually made up of a rainbow of colors called a spectrum. If you look very close at this rainbow, you might notice tiny gaps. This is not missing data but hidden information.
In the 1800s, Franhofer, who found these tiny gaps in that rainbow, theorized the light was absorbed by the presence of elements. This took astronomy from a strictly observational science to an empirical one and combining it more tightly to physics and chemistry.
Like our own DNA, these gaps tell us a story about the light.
The National Solar Observatory collected detailed spectra from the Sun. This data is extremely detailed (If printed onto a strip a few inches wide, the roll of paper would extend for several hundred yards). It is rich in information but scientists complain that it is hard to find and even harder to use.
My tool creates a way to explore this spectra in hot parts of the Sun and also the cooler parts we find in sunspots. tool, the information becomes accessible and with this easier to use format , the more possible it is to link those different pieces of information. This is the adjacent possible, a kind of future look at a subject. We see some of the nearby stars but the vast majority of stars near our Sun are invisible; they are too small and cool to see. While we can’t use our Sun to study stars hotter than our Sun, we can use our closest star to know these cool nearby suns. Knowing what elements are present at a wide range of temperatures within our Sun might lead to discoveries of new elements or more importantly lead scientists to understand new processes that we don’t see here.
- Built in D3
- Steep learning curve
- Data is not normalized so hard to work with together
- Large datasets
- Units between atlases mixed
- Data needs to be added to database
- API that will deliver JSON to easily be invested
- JSON schema created
What’s next with tool
- Just a first step
- Add visible tooltips
- Add brushing to help better explore dataAdd other atlases (compare different data with either two charts or overlaid charts)
- Create way to compare measurements in atlas and the atlas itself
- Improve output methods…needs more user feedbackAdd indexes of known telluric elements…note what element is where
- Add way to increase resolution
What’s next for me
- Continue creating every day
- More photography
- More writing
- Illustrate new book
- Find publisher for 2 books or focus more on self publishing
- Compile pictures and poems
- Work on getting Constellora to market. Promote
- Patent hit point puck and talk to hasbro…owners of D&D now…about the idea
- Build the other 30 things I dreamed up while in ATLAS…looking for adjacent possible
================================================================
API NOTES
-
POST (create a resource or generally provide data)
-
GET (retrieve an index of resources or an individual resource)
-
PUT (create or replace a resource)
-
PATCH (update/modify a resource)
-
DELETE (remove a resource)
-
id (auto generated UUID)
-
datasource
-
wavelength
-
irradiance
-
id (autogenerated)
-
datasource
-
wavenumber
-
solar_component
-
atmospheric_component
-
observed_spectrum
-
id (autogenerated)
-
datasource
-
wavenumber
-
solar_component
-
atmospheric_component
-
total
-
id (autogenerated)
-
datasource
-
wavenumber
-
umbral_component
-
observed_spectrum
-
id (autogenerated)
-
datasource
-
wavenumber
-
umbral_spectrum
-
reference_spectrum
-
observed_spectrum
-
id (autogenerated)
-
datasource
-
frequency
-
telluric_spectrum
-
umbral_spectrum
-
umbral_spectrum_corrected
-
id (autogenerated)
-
datasource
-
wavenumber
-
transmission_spectrum_reduction
-
umbral_spectrum_cold_corrected
-
cold_transmission_spectrum
-
id (autogenerated)
-
datasource
-
wavenumber_frequency
-
corrected_spectrum
-
transmission_function
-
observed_spectrum
-
id (autogenerated)
-
datasource
-
??
-
??
-
??
-
id (autogenerated)
-
datasource
-
frequency
-
deduced_telluric_spectrum
-
observed_photospheric_spectrum
-
photospheric_spectrum_corrected
|
Route
|
Verb
|
Description
|
Variables
|
|
/atlases
|
GET
|
get all atlases
|
|
|
/atlas/wavelengths
|
GET
|
get all wavelengths for specific atlas
|
|
|
/atlas/wavelengths
|
GET
|
Get wavelengths and spectrum between high and low
|
spectrumLow, spectrumHigh
|
Other Notes:
-
March 1 – I should convert this data to a database, create an API that would deliver JSON to other applications including mine.
-
March 1-7: researching how to build an api
-
Monday March 15 –
-
Monday March 22 – setup Mongo db locally. trying to learn
-
Tuesday March 23 – imported small dataset to local mongodb
-
Monday – April 5 – sent HTML mockup to advisors and others within the NSO.
-
Monday – April 6 – completed RegEx to create a way to convert multiple files to CSV
-
Monday April 6 – completed converter for fluxatl
-
Tuesday April 7 – completed converter for visatl atlas
-
Tuesday – April 7 – JSON schema for visatl atlas
-
Wednesday April 8 – oddity in data. Question out to Alexei to help resolve.
-
Friday April 9 – on the off chance that the -1. that is stuck to the end of some values is supposed to be in its own column, I added regex to replace script to find instances of “0-1.” and replace with “0 -1.” The rest of the script should then replace that space with a comma. It’s working. Awaiting answer to question about the purpose of the -1 in the data. If there is one.
-
Sat April 10
-
DISCOVERED: found that -1. denotes excessive noise (a kind of null value??)
-
started bulk conversion of text files to json
-
ISSUE: ran into an issue with visatl. 13500-19950 are 4 columns. Above 20000 though, two columns exist. Will have to adjust my script (there are multipliers of certain data files here. I’ll have to figure out how that figures into the display)
-
CREATED scripts for niratl, photatl, spot1atl.
-
CONVERT cm-1 -> angstroms (show both scales on chart
-
angstroms along the top
-
cm-1 along the bottom
-
-
LEARNING how to load json in v6. It uses a promise
-
instead of something like
-
d3.json(“sp13550_short.json”, function(d) {console.log(d);}
-
-
turns into
-
d3.json(“/_files/sp13550.json”).then(function(d){console.log(d)});
-
-
-
LEARNING how to traverse json structure to output intended data
-
d3.json(“/_files/sp13550.json”).then(function(data){
-
console.log(data[1].frequency)
-
});
-
-
-
Sun April 11
-
More issues with the data. I will have to scrub out NaN values. – replaced with -1. as per other “noisy” values.
-
new plot – 13500-14950 (after cleaning up the data)
-
Added functions
-
Download PNG
-
Download SVG
-
-
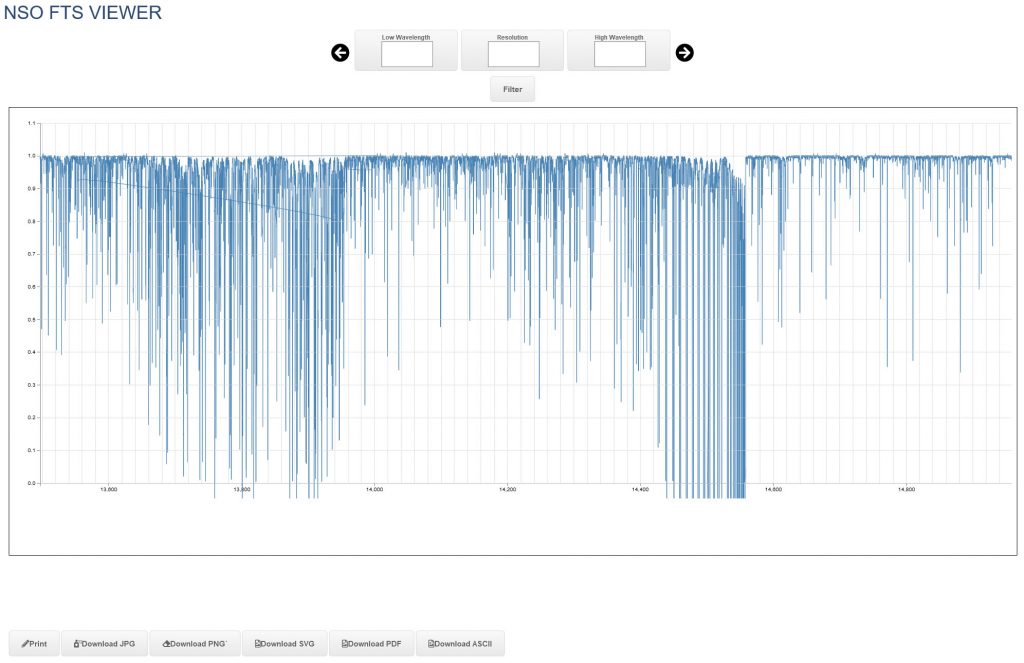
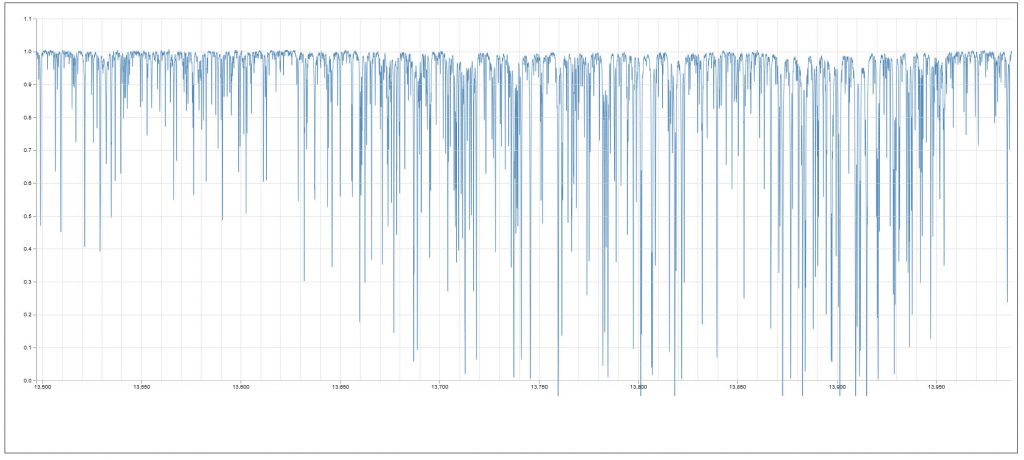
questions. what is the downward line at the left – turns out that the CSV file was not sorted by wavelength, so the chart drew this line sequentially. The data turned up later in draw, so it filled it in.
-
-1 values are causing data to drop below 0 in many areas.
-
dataset takes about 30 seconds or so locally to load. This limited size JSON file is 17.1MB
-
-
-
Showing area of data where weird line is created – data was not sorted. When data was truncated (last parts deleted), the error shows.
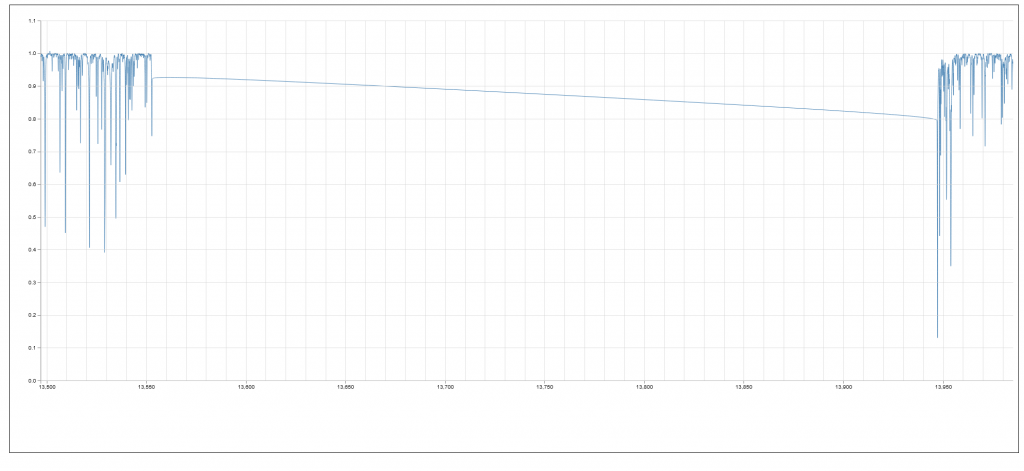
- after sorting and recompiling, the graph is correct
-
Monday, April 12 – talked with Justin about data approach
-
Wednesday, April 14 – talked with Alexei about science questions and interface
-
change initial data from observed to telluric
-
add labels
-
add top label with angstroms
-
add branding
-
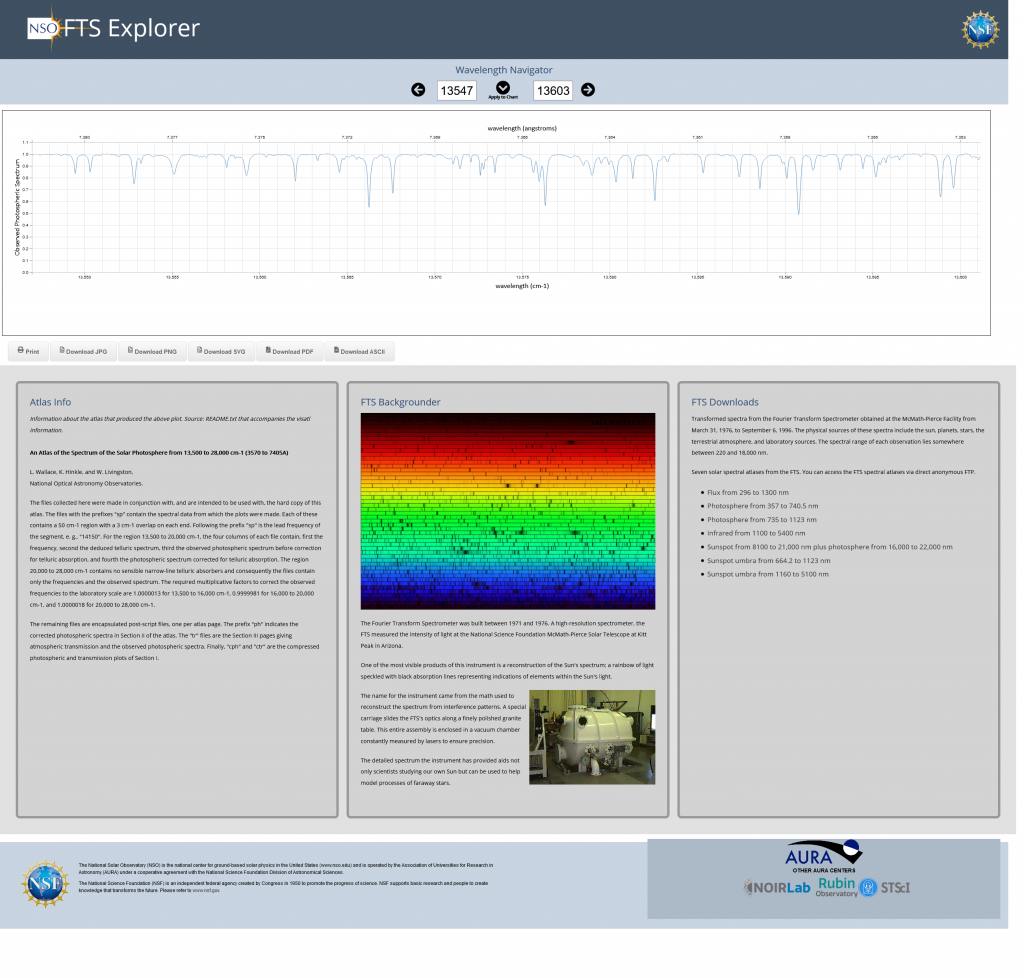
add text descriptions about atlas and FTS explanation
-
discussed missing data; Alexei suggested coding the chart so that the path hops the missing value (no line break)
-
Also, for visatl…with values above 20,000. The observed value (second column can be used) since telluric values are not included.
-
-
Thursday, April 15 – started adding branding elements (NSO logo, NSF logo) – following recently completed web style guide
-
Friday, April 16
-
more branding CSS (footer, header, new text areas for atlas description and FTS description
-
may need to reconsider layout of navigation area at top (takes up a lot of room)
-
-
Saturday April 17
-
convert csv to json using csvjson library
-
converted 15000-16950, 17000-19950, 20000-27950
-
created json from 13500-27950 – I’m not sure we’ll use this file (csv = 31MB, json =
-
-
added labels to xaxis and yaxis
-
needed to adjust CSS and svg size to accomodate top and bottom labels
-
-
added top axis to chart.
-
Using tickformat()
-
Converting cm-1 > nm > angstroms ((10000/x) * 10000)
-
limited angstrom value to 0 decimal places
-
-
-
found some oddities in data file sp13500-14950.json. range of frequency reports 0.356 – 15003. but so far cannot find 0.356 as a frequency.
-
looking at minIndex.
-
50394 is the minIndex but that data looks good.
-
-
Another oddity in data. Path peters out at ~14371.22
-
turns out that at 14371.260 there was a NaN value;
-
-
-
Sunday April 18
-
Sorted out incorrect values in dataset 20000-27950. Chart displays correctly
-
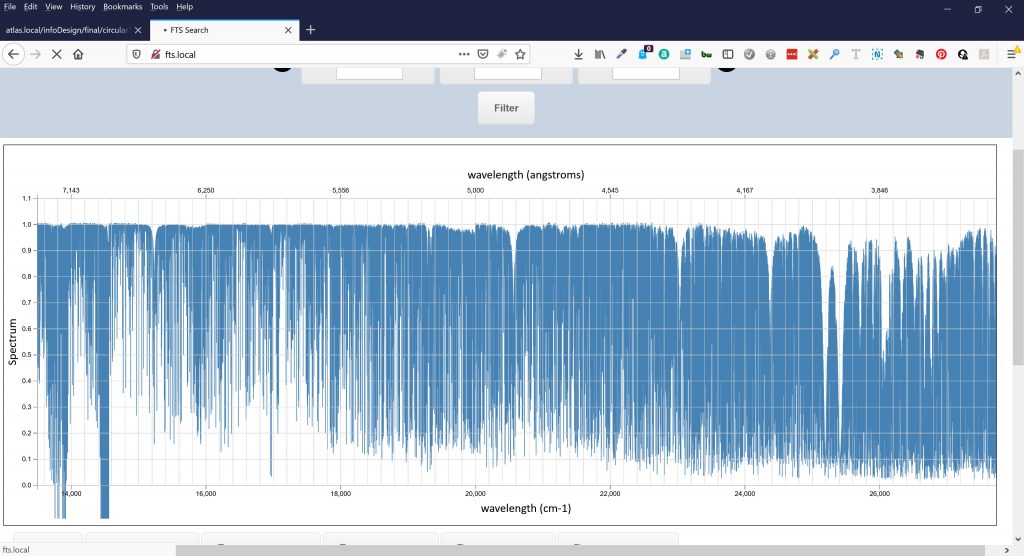
- Worked on adding photatl data is messy but produces this graf
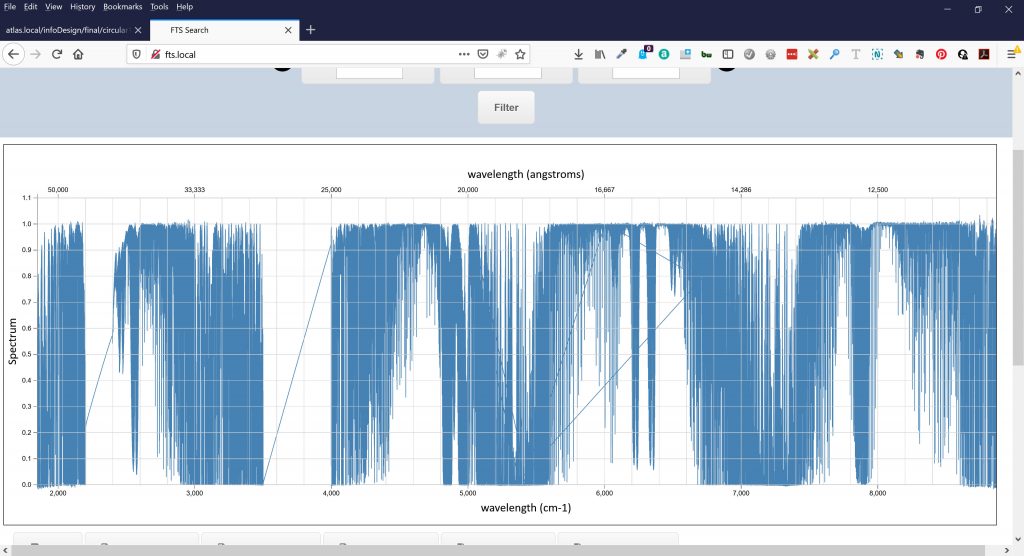
- left hand of data needs to be withing bounds of chart
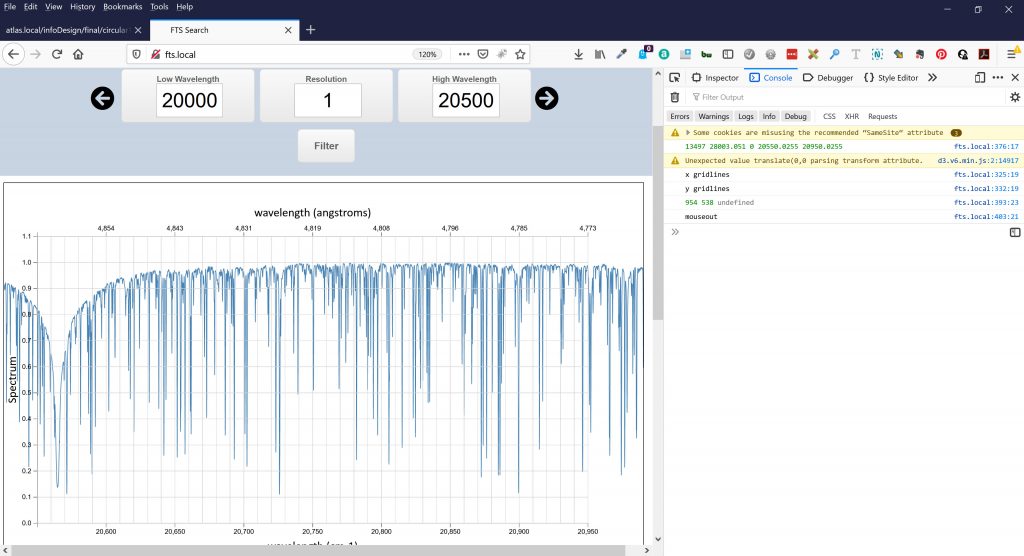
Last Minute Updates
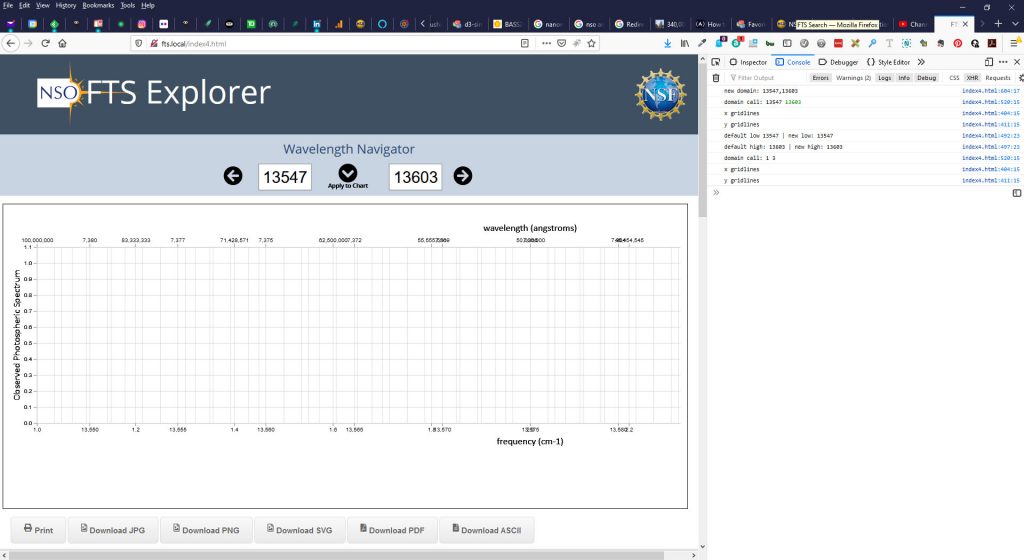
Left and Right Navigation buttons show in console correct settings. The “Apply” button sends proper command but values are wrong. The chart appears to try and update but with the wrong values, the chart is empty. Very close to interactivity
