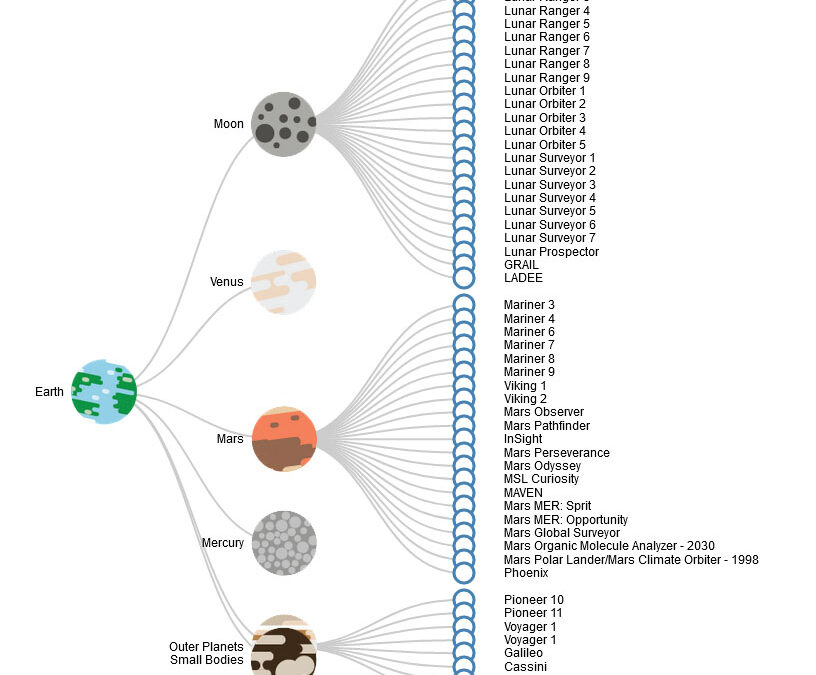
Planetary Exploration Budgets Client: Services: Role: Type: Year: This data visualization was created as a class assignment but I wanted to give the data some background. The resulting artifact combines data with storytelling to create an argument that while the Moon...
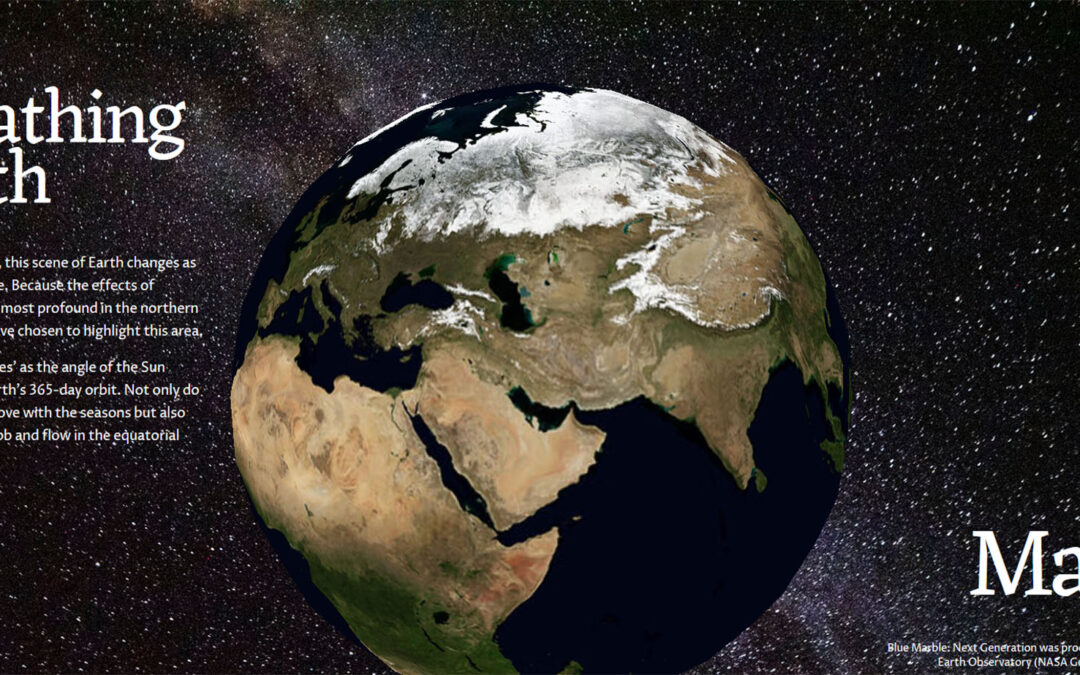
Breathing Earth Client: Services: Role: Type: Year: Every five seconds, this scene of Earth changes as the months change. Because the effects of seasonal change is most profound in the northern hemisphere, we have chosen to highlight this area. The planet...
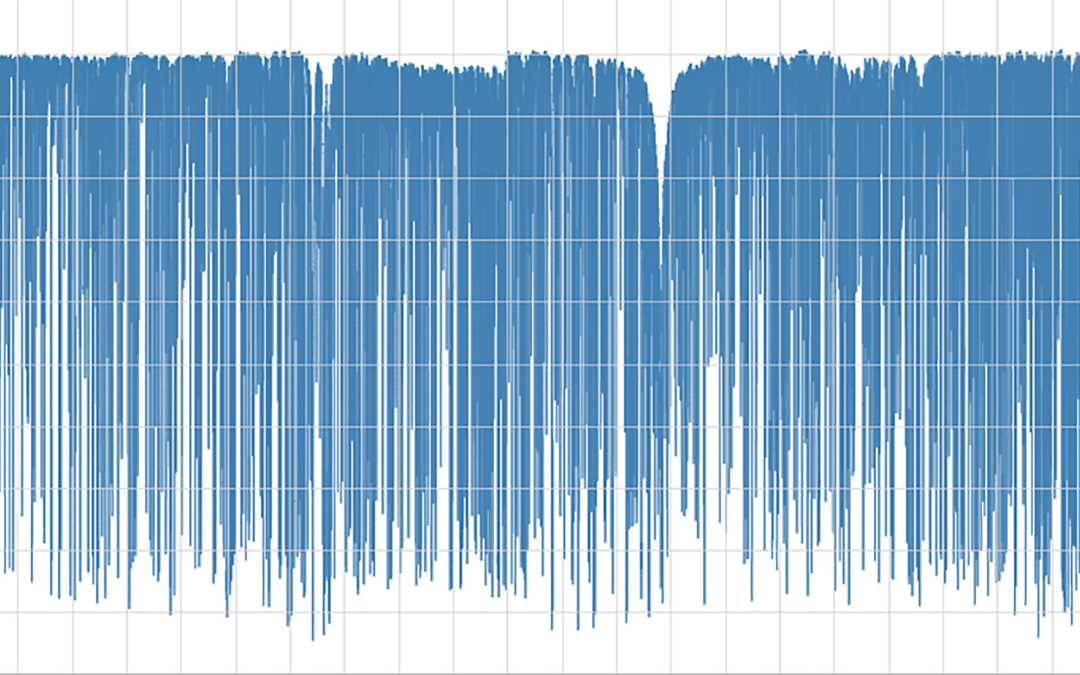
Spectrum Explorer Client: Services: Role: Type: Year: The National Solar Observatory collected detailed spectra from the Sun. This data is extremely detailed (If printed onto a strip a few inches wide, the roll of paper would extend for several hundred yards). It...
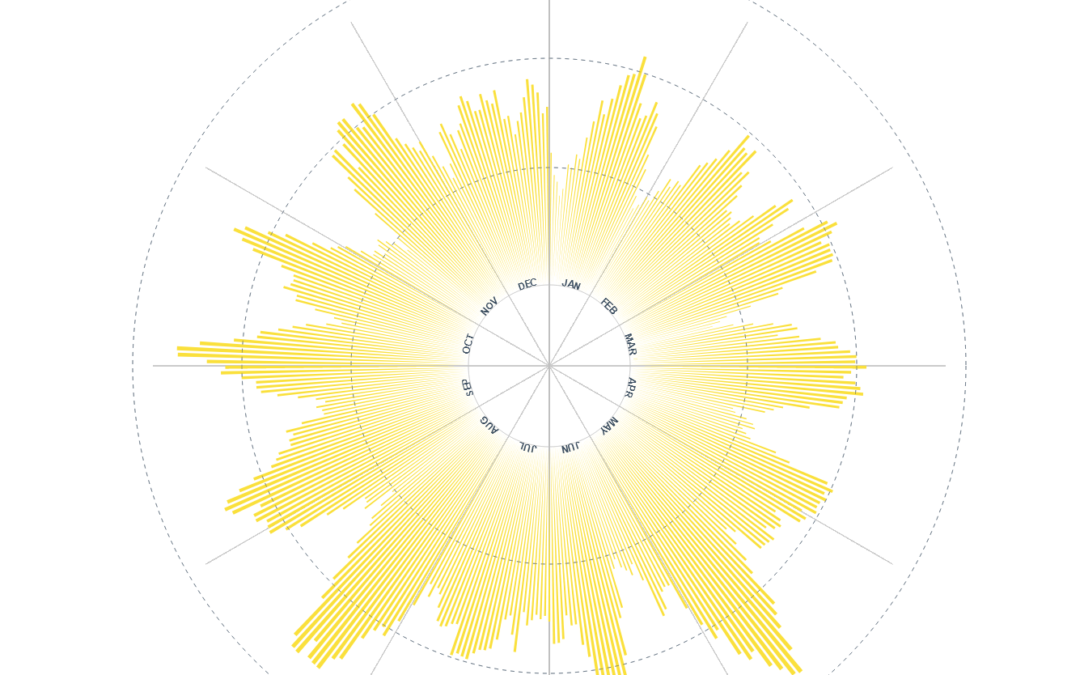
Visualizing Sunspot Numbers Client: Services: Role: Type: Year: For the visualization, I wanted to create a way to explore the Sun’s activity using sunspot numbers. The more sunspots in a year, the more solar activity is seen through solar flares and coronal mass...